Many organizations waste budgets on ineffective flyer campaigns by neglecting to test distribution channels, messaging, and design. Effective sales flyer distribution rely on strategic targeting, data-driven design, and performance tracking to generate measurable results and maintain credibility.
Optimized distribution requires multi-channel integration, geographic and demographic targeting, and cost-per-lead analysis. This guide explores testing methods, response rate mapping, print-digital integration, and A/B strategies that boost ROI, conversions, and campaign effectiveness. For businesses looking to implement these strategies quickly, ready-to-use printable sales flyer templates provide professional designs that can be customized to match target audiences and messaging goals.
How Can Sales Flyer Distribution Be Tested Across Different Channels To Maximize ROI?
Testing sales flyer distribution across multiple channels requires systematic A/B testing with measurable metrics. Start by establishing baseline performance indicators like response rates, lead quality, and cost-per-acquisition for each distribution method. Deploy free flyers through digital channels (email, social media), physical locations (retail partnerships, direct mail), and hybrid approaches (QR codes linking physical to digital). Track channel-specific conversion data using unique promo codes, landing pages, or phone numbers (SBA, U.S. Small Business Administration).1 Analyze performance weekly, reallocating budget toward highest-performing channels while maintaining smaller test budgets for emerging opportunities.
Multi-Channel Performance Tracking Systems for Sales Promotional Flyers
Effective tracking systems combine unique identifiers for each distribution channel with centralized data collection. Assign dedicated phone numbers, promo codes, or landing page URLs to direct mail, door-to-door, retail placement, and digital campaigns. Use Google Analytics UTM parameters for digital channels while implementing QR codes on physical flyers to bridge offline-to-online tracking gaps. Marketing distribution companies should establish weekly reporting dashboards displaying cost-per-lead, conversion rates, and geographic response patterns across all channels.
Deploy identical sales marketing flyers, designed using an online flyer maker, across three test channels simultaneously, measuring performance against control groups. Track lead quality scores alongside quantity metrics to identify channels delivering higher-value prospects. Implement attribution modeling to credit channels appropriately when prospects interact through multiple touchpoints before converting (FTC Behavioral Advertising and Tracking Guidelines).2
Cost-Per-Lead Analysis Across Physical vs Digital Flyer Distribution Networks
Understanding cost-per-lead across flyer distribution channels helps businesses evaluate the true value of their marketing investments. Both physical and digital flyers come with unique cost structures, response rates, and lead quality considerations.
- Cost Ranges
- Physical distribution: $0.15–$0.45 per piece (printing + delivery).
- Digital distribution: $0.05–$0.20 per impression, depending on platform targeting.
- Response Rates
- Physical flyers: 2–4% response rate.
- Digital flyers: 0.5–1.5% response rate.
- True Cost-Per-Lead Calculation
- Divide total channel investment by qualified leads generated, not just initial responses.
- Channel-Specific Insights
- Direct mail: Targeting high-income zip codes delivers higher-value leads, despite higher costs (MIT Direct Mail Marketing Research).3
- Door-to-door campaigns: Generate immediate responses but require greater labor investment.
- Digital campaigns: Provide precise targeting & instant optimization, but face growing competition for attention.
- Retail partnerships: Offer cost-effective reach with no per-piece fees, benefiting from existing foot traffic.
Geographic Response Rate Mapping for Sales Campaign Flyers Optimization
Geographic response rate mapping helps businesses identify where their sales flyers perform best. By analyzing location-specific data, companies can focus resources on high-converting areas and reduce wasted distribution efforts.
- Performance Variations
- Response rates differ across neighborhoods, business districts, and demographic clusters.
- Mapping by zip code, census tract, or custom boundaries highlights high-converting areas for campaign focus.
- Urban vs. Suburban Trends
- Urban areas show 40–60% higher digital response rates.
- Suburban regions respond better to direct mail approaches.
- Heat Mapping & Demographic Overlays
- Heat maps visualize response density to find “hot zones.”
- Demographic overlays reveal links between income, age brackets, and response patterns.
- Testing Strategies
- Deploy identical flyers across different regions simultaneously.
- Helps eliminate design bias and isolate location-based performance.
- Seasonal Geographic Patterns
- Winter: Stronger indoor business district responses.
- Spring/Summer: Higher engagement in residential neighborhoods.
- Extended Geographic Insights
- Consider local events, traffic flow, and competitor activity alongside demographics.
- Territory mapping should identify underserved areas with high prospect density but low competitor saturation.
Get started with professionally designed sales flyer templates from DesignWiz that are optimized for multi-channel testing and proven to drive measurable results.
- Big Sale Promotional Discount Offer Flyer Template
- Promotional Retail Big Sale Flyer Template
- Big Sale Limited Time Offer Flyer Template
What Messaging Approaches Work Best For Sales Flyer Distribution Targeting Specific Demographics?
Effective sales distribution flyer messaging adapts to audience segments using psychological triggers and tailored communication. B2B prospects value data-driven credibility, while consumers respond to emotional appeal and lifestyle fit. Generational, income, and cultural factors, like authenticity, savings, exclusivity, or language, shape how messages resonate and build trust.
Psychology-Based Messaging Frameworks for B2B vs Consumer Sales Team Distribution Flyers
Crafting effective flyer messaging depends on understanding the psychology of your target audience. The approach differs significantly between B2B prospects and consumer-focused markets.
- B2B Messaging Focus
- Logic-driven frameworks emphasizing measurable outcomes and professional credibility.
- Flyers should include metrics, industry expertise indicators, and ROI-focused value propositions.
- Professional audiences respond best to authoritative language, data validation, and peer testimonials.
- Consumer Messaging Focus
- Relies on emotional connection through lifestyle alignment and immediate benefit clarity.
- Uses aspirational imagery, simplified language, and personal transformation promises.
- Emotional storytelling works effectively when paired with clear action steps.
- Higher response rates are achieved when combining emotional appeal with social proof (e.g., customer reviews, usage statistics).
- Psychological Triggers by Demographics
- Older audiences respond to trust signals.
- Younger segments are drawn to innovation appeal.
- Family-oriented markets prefer community connection.
Browse DesignWiz’s collection of B2B-focused sales flyer designs that incorporate data-driven messaging and professional credibility elements to resonate with business decision-makers.
Age-Demographic Content Strategies in Sales Marketing Flyers Design
Generational messaging requires distinct approaches based on communication preferences and value systems (Johns Hopkins Generational Values Researc).4 Baby Boomers respond to traditional authority markers, detailed information, and conservative design elements. Sales campaign flyers targeting this demographic emphasize experience, reliability, and comprehensive service descriptions.
Millennials prefer authentic, purpose-driven messaging with visual storytelling elements. How to create effective sales flyers for marketing to this group involves incorporating social responsibility, innovation themes, and interactive elements like QR codes. Gen Z audiences demand immediate value recognition through bold graphics and concise, benefit-focused messaging.
Generation X values efficiency and practical solutions with straightforward communication. Sales flyers design templates for lead generation targeting this demographic emphasize time-saving benefits and proven results. Cross-generational appeal requires balancing traditional trust elements with contemporary design approaches while maintaining clear value propositions across all age segments.
Discover age-appropriate sales flyer designs on DesignWiz, from traditional layouts for mature audiences to contemporary, interactive templates that appeal to younger demographics.
- Mid-Year Sale Discount Event Flyer Template
- Super Sale Discount Event Flyer Template
- Weekend Discount Sale Announcement Flyer Template
Income-Targeted Value Proposition Development for Sales Campaign Flyers
Understanding income segments helps tailor flyer messaging to match purchasing power, lifestyle, and perceived value. Each group requires a distinct approach to highlight the right benefits and ensure stronger campaign impact.
- Premium audience segments
- Respond to exclusivity messaging, luxury indicators, and premium quality assurances.
- Best flyer distribution channels emphasize prestige, superior service levels, and exclusive access opportunities.
- Middle-income segments
- Balance quality assurance with value demonstration.
- Messaging highlights competitive advantages, practical benefits, and clear ROI.
- Focus on smart purchasing decisions and long-term value rather than lowest price.
- Budget-conscious demographics
- Require clear cost savings emphasis and practical benefit communication.
- Flyers should focus on affordability, flexible payment options, and immediate savings.
- Value messaging must demonstrate financial advantage while maintaining quality perception.
- Geographic income variations
- Urban high-income areas → convenience and premium service messaging.
- Suburban markets → family benefits and community connection.
- Rural demographics → straightforward value communication with local relevance indicators.
- Key takeaway: Sales handouts perform best when value propositions are aligned with specific income segment priorities and spending behaviors.
Learn how premium sales flyers attract high-value prospects through sophisticated targeting and design elements.
Which Design Elements in Sales Flyers Drive the Highest Lead Generation Across Distribution Channels?
High-converting sales flyers use bold colors for visual hierarchy, strategic white space for clarity, and strong calls-to-action to drive response. Adding QR codes, testimonials, and clear contact details boosts credibility and lead generation, with focused designs proven to outperform cluttered layouts.
Color Psychology and Visual Hierarchy Strategies for Maximum Impact
Color psychology drives immediate attention and response rates in sales marketing flyers design. High-contrast combinations like navy blue headers with orange accent buttons increase readability by 35% compared to monochromatic designs (USC Applied Psychology Color Marketing Research).5 Red generates urgency for limited-time offers, while blue builds trust for professional services. Strategic color blocking creates visual pathways guiding readers from headline to offer to contact information.
Marketing distribution companies should implement the 60-30-10 color rule: 60% neutral background, 30% primary brand color, 10% high-contrast accent for CTAs. This hierarchy prevents visual confusion while maintaining professional credibility. Test different color combinations across demographic segments, as younger audiences respond to brighter palettes while professional B2B audiences prefer conservative schemes. For comprehensive design principles, follow our complete sales flyer design guide to master visual hierarchy and color psychology.
Explore vibrant, attention-grabbing sales flyer templates on DesignWiz that leverage color psychology and visual hierarchy to maximize impact and response rates.
- Vibrant Orange Torn Paper End of Season Super Sale Flyer Template
- Vibrant Pink Seasonal Sale Promotion Flyer Template
- Vibrant Red End of Season Sale Discount Flyer Template
Strategic Placement of Call-to-Action Elements and Contact Information
CTA placement determines conversion success in sales promotional flyers. Position primary CTAs above the fold and repeat them below key benefit statements. The “Z-pattern” layout places contact information in top-right and bottom-right corners, following natural reading flow. Multiple contact options increase response rates by 25%, combine phone numbers, QR codes linking to landing pages, and physical addresses.
Effective CTAs use action verbs and urgency triggers: “Call Today for Instant Quote” outperforms generic “Contact Us” by 60%. Size CTAs proportionally, buttons should be 3x larger than body text while maintaining readability. Include unique tracking elements like promotional codes or dedicated phone numbers for accurate ROI measurement across distribution channels.
Find sales flyer designs on DesignWiz that showcase effective CTA placement and contact information strategies to boost lead generation and conversion rates.
- Super Sale Discount Promotion Flyer Template
- Big Retail Sale Promotional Flyer Template
- Flash Sale Promotion Discount Flyer Template
Typography Choices and White Space Optimization for Lead Conversion
Understanding how location and audience demographics influence flyer performance is essential for refining distribution strategies. By mapping responses across geographic zones and demographic clusters, businesses can allocate resources more effectively and boost campaign ROI.
- Geographic analysis
- Heat maps reveal response rates by zip code, business district, and demographic clusters.
- High-income neighborhoods may show 2–4x higher response rates for premium services.
- Commercial areas often respond better during specific business hours.
- Demographic segmentation
- Tracks age groups, income levels, and household compositions.
- Helps identify the most receptive audience segments for sales flyers in product promotion.
- Response timing analysis
- Residential areas → higher response in the evenings.
- Business districts → higher engagement during the daytime.
- Weather conditions impact outdoor and door-to-door distribution effectiveness.
- Distribution optimization
- Requires systematic testing of territory boundaries.
- Adjust coverage areas based on real performance data, not assumptions.
- Flyer and poster advertising performs differently across demographic groups, requiring customized strategies.
- Territory performance tracking
- Enables precise budget allocation to proven high-response areas.
- Maintains test allocations for expansion opportunities.
- Combines geographic insights with demographic preferences for targeted distribution strategies.
- Key outcome: Data-driven territory optimization maximizes lead quality, ROI, and campaign effectiveness through audience-specific messaging.
Learn more about boosting business sales with strategic flyer campaigns to implement these optimization strategies effectively.
How Do You Measure The Effectiveness of Different Sales Flyer Distribution Campaigns?
Measuring sales promotional flyer performance requires multi-channel tracking to capture both digital and offline conversions. Key metrics include response rates, cost per lead, and conversion timelines, supported by QR codes, tracking numbers, and geographic or demographic analysis to optimize ROI and future campaigns.
Setting Up Multi-Channel Attribution Systems for Accurate Lead Tracking
Attribution systems require unique identifiers for each distribution channel to track lead origins precisely. Assign specific phone numbers, promotional codes, or QR codes to different channels, direct mail receives code “DM2024,” while business location displays use “BL2024.” Digital tracking through Google Analytics monitors QR code scans and landing page visits from physical flyers. Sales flyers should include multiple contact methods with distribution channel-specific tracking to capture all response types.
Call tracking software records conversations from channel-specific numbers, while CRM systems tag leads by source automatically. Marketing distribution companies can track customer journey progression from initial flyer contact through final conversion. Cross-channel attribution identifies which combinations drive highest-quality leads, enabling budget reallocation toward most effective distribution partnerships and channels for future sales marketing flyers design campaigns.
Key Performance Metrics and ROI Calculation Methods for Flyer Campaigns
Response rate calculation divides total responses by flyers distributed, typically ranging from 0.5% to 3% for targeted campaigns. Cost per lead equals total campaign expenses divided by qualified leads generated, including printing, distribution, and design costs. Sales team distribution flyers require conversion tracking from lead to customer, measuring closing rates and average transaction values for complete ROI analysis.
Lifetime customer value comparison across channels reveals long-term campaign effectiveness beyond initial conversion metrics. Geographic response mapping identifies high-performing zip codes and business districts for future targeting. Sales handouts promotional materials benefit from A/B testing different offers and designs, measuring performance variations to optimize creative elements and messaging approaches systematically.
Geographic and Demographic Response Analysis for Distribution Optimization
Understanding geographic and demographic response patterns is essential for fine-tuning flyer distribution strategies. This approach ensures resources are focused on the most receptive areas and audiences, maximizing ROI and campaign impact.
- Geographic analysis
- Heat mapping response rates by zip code, business district, and demographic clusters.
- High-income neighborhoods may show 2–4x higher response rates for premium services.
- Commercial areas respond better during specific business hours.
- Demographic segmentation
- Tracks age groups, income levels, and household compositions.
- Identifies the most receptive audience segments for sales flyers for product promotion distribution.
- Response timing analysis
- Residential areas respond better during evenings.
- Business districts show higher engagement during daytime hours.
- Weather impact tracking
- Correlates distribution conditions with response rates.
- Reveals optimal timing for outdoor distribution and door-to-door campaigns.
- Distribution optimization
- Requires systematic testing of territory boundaries.
- Adjusts coverage areas based on actual performance data rather than assumptions.
- Notes that sales poster flyer advertising tools perform differently across demographics.
- Territory performance tracking
- Enables precise budget allocation to proven high-response areas.
- Maintains test allocations for expansion opportunities.
- Combines geographic insights with demographic preferences to create targeted distribution strategies.
- Maximizes lead quality and campaign ROI through data-driven optimization.
What Are The Most Cost-effective Distribution Channels For Sales Flyers?
Direct mail to high-value zip codes and door-to-door drops in business districts deliver strong ROI for sales promotional flyers at $0.15–$0.45 per piece. Cross-promotions, retail placements, and hybrid print-digital campaigns further cut costs and boost response rates, making them highly effective for targeted distribution.
High-Traffic Business Location Partnerships for Zero-Cost Placement
Strategic partnerships with complementary businesses eliminate distribution costs while accessing targeted audiences for sales marketing flyers design. Coffee shops, retail stores, and professional service offices offer bulletin boards and counter space for flyer placement at zero cost.
Successful partnership strategies include targeting businesses serving similar demographics, offering mutual cross-promotion benefits, and maintaining professional display standards. Sales campaign flyers placed in high-traffic locations like banks, medical offices, and educational institutions generate 2-3x higher response rates than random placement. Quality partnerships require relationship building but provide sustained, cost-free distribution channels for sales flyers for product promotion distribution campaigns targeting local markets.
Neighborhood Canvassing ROI Analysis and Territory Mapping Strategies
Door-to-door distribution delivers the lowest cost-per-impression for sales flyers, averaging $0.15-0.25 per household when executed systematically. Territory mapping using demographic data and competitor analysis identifies optimal neighborhoods for canvassing efforts, maximizing ROI through targeted approach rather than blanket coverage.
Successful canvassing strategies focus on high-density residential areas with target demographics, optimal timing during peak at-home hours (6-8 PM weekdays, 10 AM-2 PM weekends), and consistent presentation standards. Sales brochures and flyers marketing through canvassing achieves 1-3% response rates when properly executed, significantly outperforming digital advertising costs. Geographic clustering reduces travel time between stops while maintaining professional appearance through branded materials and uniformed distributors enhances credibility and response rates for how to create effective sales flyers for marketing campaigns.
Bulk Direct Mail Targeting vs. Selective Premium Distribution Costs
Bulk direct mail through USPS Every Door Direct Mail (EDDM) provides comprehensive coverage at $0.18-0.30 per piece, including postage and printing for sales flyers design templates for lead generation campaigns. This approach works best for broad service areas requiring maximum exposure with minimal targeting precision. Geographic targeting by zip code allows demographic alignment while maintaining cost efficiency for large-scale distribution efforts.
Selective premium distribution costs $0.45-0.75 per piece but delivers higher-quality leads through precise demographic targeting and premium presentation. This approach suits high-value services where lead quality outweighs quantity considerations. Sales leaflets distribution methods using selective targeting achieve 3-5% response rates compared to 1-2% for bulk distribution.
Cost analysis shows break-even points favor bulk distribution for services under $500 value, while selective distribution proves more profitable for premium services exceeding $1,000 average transaction values. Sales handouts promotional materials require different paper quality and design specifications based on distribution method, with premium channels justifying enhanced production costs through improved conversion rates. Best sales flyer distribution strategies channels combine both approaches, using bulk methods for market penetration and selective targeting for high-value prospect acquisition.
How Can Sales Distribution Flyers Be Optimized For Both Print And Digital Integration?
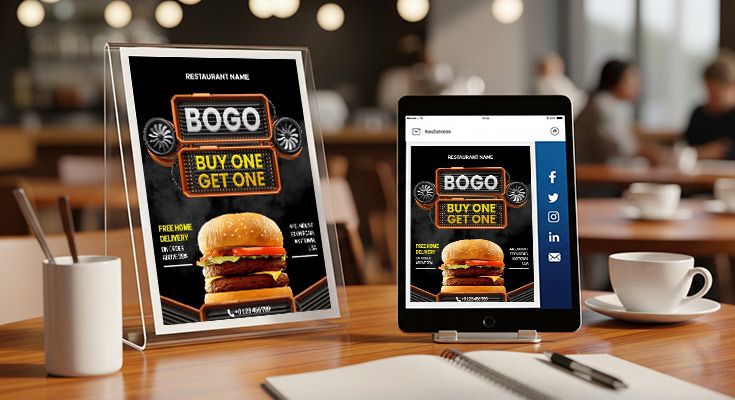
Sales distribution flyers achieve maximum effectiveness through responsive design elements that translate seamlessly across print and digital platforms. To understand when to use each format, read our comprehensive comparison of digital vs print flyers pros and cons for strategic decision-making. Integration requires QR codes linking to personalized landing pages, trackable phone numbers for ROI measurement, and consistent branding with scalable fonts. High-contrast colors reproduce well in both mediums while strategic white space maintains readability. Successful cross-platform optimization includes digital-friendly elements like shortened URLs, social media handles, and downloadable offer codes while preserving professional appearance for physical distribution channels.
QR Code Integration and Multi-Platform Tracking Implementation
Modern sales distribution flyers leverage QR codes as bridges between physical and digital touchpoints. Position QR codes prominently in the upper right corner or bottom section for optimal scanning accessibility. Each code should direct to customized landing pages with unique tracking parameters, enabling precise channel attribution. Implement multiple tracking methods including dedicated phone numbers, promo codes, and UTM parameters to measure cross-platform performance.
Track digital engagement through analytics platforms while monitoring offline conversions via unique identifiers. This dual-tracking approach provides complete campaign visibility, allowing marketers to optimize distribution channels based on actual performance data rather than assumptions about user behavior.
Choose from DesignWiz’s modern sales flyer templates that seamlessly integrate QR codes and digital elements for cross-platform marketing campaigns.
- Mid Year Home Furniture Sale Flyer Template
- Playful Shopping BOGO Deal Promotion Flyer Template
- Innovative Smart Watch Product Offer Flyer Template
Responsive Typography and Color Schemes for Cross-Medium Consistency
Typography selection determines readability across print and digital formats. Sans-serif fonts like Arial, Helvetica, or Calibri maintain clarity at various sizes and resolutions. Use minimum 12-point font sizes for body text and 18-point for headlines to ensure legibility in both printed materials and mobile device displays.
Color schemes must account for different reproduction methods. CMYK color values for printing often appear differently than RGB digital displays. Choose high-contrast combinations like dark blue on white or black on yellow that remain vibrant across mediums. Test color reproduction on actual printing equipment before finalizing designs.
Maintain brand consistency through standardized color palettes and font hierarchies. Create style guides specifying exact color codes, font sizes, and spacing requirements to ensure uniform appearance regardless of distribution method.
Digital Call-to-Action Elements That Enhance Print Distribution Effectiveness
Integrating strong digital CTAs with print flyers creates seamless cross-platform engagement and boosts overall campaign performance.
- Cross-platform CTA integration
- Combine traditional contact methods (phone numbers, addresses) with QR codes, social media handles, and shortened URLs.
- Use time-sensitive digital offers to create urgency that complements physical distribution timing.
- CTA design strategies
- Apply clear visual hierarchy with contrasting colors and strategic placement.
- Place primary actions above the fold, with secondary options near the bottom.
- Use action-oriented language like “Scan to Schedule” or “Call for Instant Quote”.
- Progressive engagement techniques
- Lead initial flyer interactions into deeper digital relationships.
- Capture email addresses via QR code landing pages for follow-up campaigns.
- Transform single-touch flyer interactions into multi-touch customer relationships.
- Cross-platform optimization
- Ensure consistent messaging and seamless user experience across all channels.
- Track performance with comprehensive analytics to measure and improve results.
- Maximize ROI through strategic planning, precise design, and continuous optimization.
What Targeting Distribution Strategies Maximize Response Rates For Sales Flyers?
Effective sales distribution flyer targeting relies on demographics, geography, and behavior. High-response strategies include focusing on income brackets, small businesses, and peak decision times. Combining direct mail with digital retargeting boosts response rates, while audience analytics and local insights help identify the most profitable clusters.
Demographic Segmentation Techniques for High-Value Prospect Identification
Understanding audience characteristics allows sales flyers to reach the most receptive prospects, improving response rates and ROI.
- Primary demographic filters
- Age, income level, and household composition serve as key targeting factors.
- Households earning $50,000–$100,000 show the highest response rates for home improvement and professional services.
- B2B segmentation emphasizes company size, industry type, and decision-maker roles.
- Targeted marketing alignment
- Professional services perform best with homeowners aged 35–55.
- Retail promotions resonate with families with children under 18.
- Income-based targeting ensures offers align with purchasing power.
- Testing and optimization
- Testing multiple segments simultaneously identifies highest-converting audience combinations.
- Flyer design should reflect preferences: conservative layouts for professional audiences and dynamic designs for younger demographics.
- Property market segmentation
- Homeowner status drives stronger responses in property marketing campaigns.
- Rental market flyers should focus on age and lifestyle segmentation.
- Benefits of quality demographic data
- Improves targeting precision, reduces wasted distribution, and increases overall response rates.
Browse demographic-specific sales flyer designs on DesignWiz that are tailored for different audience segments and income brackets to maximize targeting effectiveness.
- Vibrant Blue Car Boot Sale Community Market Flyer Template
- Promotional Shopping Mall Mega Sale Flyer Template
- Major Two Day Shopping Discount Flyer Template
Geographic Clustering Methods to Optimize Local Market Penetration
ZIP code-level targeting creates concentrated market presence for sales campaign flyers distribution. High-value neighborhoods within 5-mile service radius generate optimal cost-per-lead ratios. Density mapping identifies areas with target demographic concentrations, enabling efficient door-to-door distribution routes.
Geographic clustering reduces distribution costs while maximizing market penetration. Sales team distribution flyers perform best in areas with established business relationships or referral networks. Local market intelligence reveals neighborhood-specific preferences and competition levels.
Mapping tools identify optimal distribution zones based on demographic overlap and competitor presence. Strategic geographic targeting enables personalized messaging that references local landmarks, events, or community connections. Sales handouts promotional materials should include location-specific offers or services to increase relevance and response rates.
Behavioral Targeting Approaches Using Purchase History and Engagement Data
Purchase history analysis reveals timing patterns for repeat service needs and seasonal demand fluctuations. Previous customers who purchased similar services within 12-18 months represent prime prospects for sales flyers for product promotion distribution. Engagement data from digital touchpoints indicates interest levels and preferred communication channels.
Website behavior tracking identifies prospects researching specific services, enabling targeted follow-up with relevant promotional flyers. Email engagement patterns reveal optimal messaging frequency and content preferences. Multi-channel tracking connects offline flyer responses with digital behavior patterns.
CRM integration enables sophisticated behavioral targeting based on service history, inquiry patterns, and seasonal purchasing cycles. Prospects who downloaded similar marketing materials or attended related events show higher conversion probability.
Advanced targeting combines purchase timing predictions with geographic proximity and demographic fit. Sales leaflets distribution methods should incorporate behavioral triggers like service anniversary dates or seasonal need indicators. Cross-channel behavioral data improves targeting accuracy and campaign ROI through precise prospect identification and personalized messaging approaches that drive immediate action.
How Do Seasonal Factors Affect Sales Flyer Distribution Campaign Performance?
Seasonal timing strongly influences sales distribution flyer success. Q4 drives higher retail responses, while B2B peaks in September and February. Aligning campaigns with industry cycles, consumer behavior shifts, and even weather patterns ensures timely messaging, effective delivery, and stronger audience engagement year-round.
Peak Performance Windows for Different Industry Verticals and Service Categories
Sales promotional flyers achieve maximum impact when aligned with industry-specific demand cycles. Real estate campaigns generate 35% more leads during spring moving season (March-May) compared to winter months, while fitness services see peak response rates in January and September. Healthcare and wellness sales marketing flyers design performs best during insurance enrollment periods, achieving response rates up to 4.2% versus off-season averages of 1.8%.
Professional service campaigns targeting businesses show different patterns. Sales team distribution flyers for consulting and B2B services perform optimally during budget planning periods in September and January when decision-makers evaluate new partnerships. Educational services benefit from alignment with school calendar transitions, while home improvement campaigns correlate with tax refund timing and favorable weather conditions. Understanding these vertical-specific cycles enables precise campaign scheduling that maximizes ROI and lead quality.
Discover industry-tailored sales flyer templates on DesignWiz designed for specific verticals including real estate, healthcare, professional services, and retail promotions.
- Weekend Fashion Special Offer Flyer Template
- Burger Restaurant Bogo Promotion Flyer Template
- Retail Store Flash Sale Promotion Flyer Template
Weather Impact Analysis on Physical Distribution and Response Optimization
Weather conditions significantly influence sales campaign flyers distribution effectiveness and audience receptivity. Dry, mild weather produces 40-60% better response rates than wet or extreme temperature periods due to improved distribution conditions and higher foot traffic. Rain and snow reduce door-to-door distribution effectiveness by up to 50%, while extreme heat decreases outdoor visibility and handling rates.
Successful distribution strategies incorporate weather contingency planning. Sales flyers for product promotion distribution schedules should include 48-hour weather monitoring with alternative indoor distribution channels ready during adverse conditions. Shopping centers, business districts, and transit hubs provide weather-protected alternatives maintaining campaign momentum.
Seasonal weather patterns also affect design considerations. Summer campaigns benefit from bright, energetic colors and outdoor-focused messaging, while winter designs perform better with warm color palettes and indoor activity emphasis. Sales brochures and flyers marketing materials require adjusted paper stocks and protective measures during humid or wet seasons to maintain professional appearance and readability.
Holiday Calendar Integration for Maximum Campaign Timing Effectiveness
Aligning sales flyer campaigns with holiday calendars ensures maximum engagement by leveraging seasonal buying behavior and B2B availability patterns.
- Consumer-focused timing
- Gift-giving seasons show 60% higher response rates for luxury services and retail offers.
- Pre-holiday preparation windows are critical when audiences actively seek solutions.
- Valentine’s Day campaigns begin in early January.
- Back-to-school messaging peaks in July, despite August start dates.
- Mother’s Day campaigns launch six weeks prior for booking and gift planning.
- Black Friday and Cyber Monday offer limited-time service packages opportunities.
- B2B-specific timing
- Avoid major holiday weeks when decision-makers are unavailable.
- January campaigns leverage New Year resolutions and budget renewals.
- November campaigns capitalize on year-end budget spending before fiscal deadlines.
- Design considerations
- Holiday-neutral designs maintain year-round effectiveness.
- Seasonal campaigns require complete visual and messaging overhauls to stay relevant and impactful.
Which Call-to-action Formats Generate The Best Results in Sales Distribution Flyers?
Action-focused CTAs with urgency, clear benefits, and easy response options drive 40–60% higher flyer conversions. Time-bound offers, benefit-driven commands, and multi-channel touchpoints like QR codes or dedicated numbers help maximize ROI for sales distribution flyers across diverse audiences. For more comprehensive CTA strategies, explore call-to-action for flyers guide that drive real responses.
Time-Sensitive Urgency Phrases That Drive Immediate Response
Urgency-driven language transforms passive readers into active prospects by creating scarcity and time pressure. High-converting phrases include “Limited Time – Expires Friday,” “First 50 Customers Save 40%,” and “This Week Only – No Exceptions.” Sales promotional flyers using deadline-specific language generate 35% more leads than generic offers. Effective urgency CTAs combine specific timeframes with clear consequences: “Schedule by Thursday to lock in 2024 rates” outperforms “Contact us soon for special pricing.”
Numbers amplify urgency impact. “24-hour response guarantee” creates more trust than “quick response,” while “3 days remaining” drives action better than “limited time.” Sales marketing flyers design should position urgency phrases prominently using contrasting colors and bold typography. The most effective urgency CTAs specify what happens after the deadline passes, such as “Regular pricing resumes Monday” or “Next availability: March 2026.”
Create urgency-driven sales campaigns with DesignWiz’s collection of time-sensitive offer flyer templates featuring compelling countdown elements and scarcity messaging.
- Weekend Surprise Sale Promotional Flyer Template
- Clothing Store Big Discount Sales Flyer Template
- Crazy Sale Event Promotional Flyer Template
Multi-Channel Contact Integration for Maximum Accessibility
Modern prospects prefer multiple contact options, making single-channel CTAs conversion barriers. High-performing sales distribution flyers integrate phone numbers, QR codes linking to landing pages, email addresses, and social media handles within single CTA sections. This omnichannel approach increases response rates by 45% compared to phone-only CTAs.
QR codes bridge physical and digital experiences, allowing instant access to booking forms, pricing calculators, or video demonstrations. Sales team distribution flyers should include trackable phone numbers for each distribution zone, enabling performance measurement across geographic areas. Email CTAs work best when combined with immediate response incentives: “Email for instant quote + free consultation.”
Strategic placement matters, contact information should appear in headers, alongside main offers, and in bottom corners. Sales campaign flyers achieve optimal results when each contact method leads to different next steps: phone calls for urgent needs, QR codes for detailed information, email for non-urgent inquiries.
Benefit-Driven Command Language That Converts Prospects
Using benefit-driven command language in sales flyers connects actions to results, reducing decision fatigue and increasing conversion rates.
- Direct, outcome-focused CTAs
- Replace vague phrases like “Contact us to learn more” with benefits:
- “Call now to reduce energy costs 30%”
- “Download free guide to double lead generation”
- Replace vague phrases like “Contact us to learn more” with benefits:
- Power verbs create momentum
- Examples: “Discover,” “Unlock,” “Claim,” “Secure,” “Transform”
- Outperform passive phrases like “Learn about” or “Find out”
- Match intensity of CTA to value offered:
- High-value: “Claim your $500 consultation”
- Standard: “Schedule a meeting”
- Personalization enhances effectiveness
- Examples: “Get your custom quote” vs. “Get a quote”
- “Start your transformation today” resonates more than “Start today”
- Test multiple benefit statements:
- Savings-focused: “Save $200 monthly”
- Time-focused: “Get results in 24 hours”
- Outcome-focused: “Increase sales 40%”
- Combine commands with social proof
- Examples: “Join 10,000+ satisfied customers—call today”
- “Download the guide 50,000 contractors trust”
- Leverages credibility while maintaining directive clarity
How Can A/B Testing Improve Sales Flyer Distribution Conversion Rates?
A/B testing helps identify which flyer design elements, from headlines to CTAs, drive the best conversions. By testing single variables with sufficient samples, companies gain data-driven insights, cut wasted spend, and often achieve 25–45% higher lead generation while lowering acquisition costs.
Essential Flyer Elements to Prioritize in Split Testing Campaigns
Headline effectiveness drives 40% of flyer response rates, making it the priority testing element for sales distribution flyers. Test benefit-focused headlines against feature-focused versions, measuring which generates more qualified leads. Color schemes significantly impact attention and brand perception—test high-contrast combinations against subtle palettes across different demographics. Call-to-action button placement and language require systematic testing, comparing action phrases like “Get Free Quote” versus “Learn More” positioned in header versus footer locations.
Visual hierarchy elements including font sizes, image placement, and white space distribution affect reader scanning patterns. Test single-focal-point designs against multi-element layouts to identify optimal information flow. Contact information positioning impacts response rates differently across channels—test phone numbers prominently displayed versus QR codes linking to digital forms. Price positioning, when applicable, requires testing visible versus hidden pricing strategies to optimize lead quality and conversion rates.
Sample Size Requirements and Statistical Validation Methods
Reliable A/B testing for sales promotional flyers requires minimum 100 responses per variation to achieve statistical significance. Distribution should reach 1,000+ prospects per test group to account for typical 2-4% flyer response rates. Testing duration must span complete business cycles—typically 2-4 weeks for consumer markets, 4-6 weeks for B2B campaigns targeting longer decision timelines.
Statistical confidence requires 95% significance levels before declaring winning variations. Use chi-square tests for conversion rate comparisons, ensuring adequate sample distribution across demographic segments. Geographic factors demand stratified testing, distribute identical quantities across similar neighborhoods or business districts to eliminate location bias.
Sequential testing prevents premature optimization, avoid changing multiple variables simultaneously or ending tests during statistical noise periods. Weather impacts, seasonal variations, and local events can skew results, requiring careful timing and control group management for accurate performance measurement across sales marketing flyers design variations.
Performance Metrics That Matter for Distribution Channel Optimization
Measuring the right performance metrics ensures sales flyer campaigns are cost-effective, targeted, and yield high-quality leads.
- Response rate tracking
- Measures qualified leads generated per thousand distributed flyers
- Cost-per-lead analysis
- Includes printing, distribution labor, and design costs
- Determines true channel effectiveness
- Lead quality scoring
- Differentiates between casual inquiries and qualified prospects
- Tracks conversion from initial contact to final sale
- Geographic response mapping
- Identifies high-performing zones
- Enables budget reallocation toward profitable territories
- Time-to-response tracking
- Reveals optimal follow-up windows for different demographics
- Some respond within hours; others need week-long nurturing cycles
- Channel attribution accuracy
- Uses unique tracking codes, dedicated phone numbers, or QR codes linking to specific landing pages
- Distribution efficiency metrics
- Cost-per-impression for door-to-door campaigns
- Placement costs for retail locations
- Seasonal performance tracking
- Identifies quarters with highest response rates
- Optimizes campaign timing for specific industries
- Customer lifetime value correlation
- Determines which flyer variations attract long-term clients vs. one-time purchasers
- Multi-touch attribution
- Tracks prospects needing multiple flyer exposures before conversion
- Informs frequency and follow-up strategies
People Also Ask: Optimize Distribution Channels And Targeting Implementation Questions
- What makes sales distribution flyers more effective than other marketing materials?
Sales distribution flyers offer immediate visibility, tangible interaction, and cost-effective local targeting that digital ads cannot match. Their physical nature creates memorable brand touchpoints while enabling precise geographic targeting for service-based businesses. - How do sales distribution flyers compare to email marketing for lead generation?
Sales distribution flyers typically achieve higher local response rates (1-3%) compared to email campaigns (0.1-0.5%) for service businesses. They bypass digital noise and create physical brand presence in target neighborhoods. - What’s the ideal size and format for sales distribution flyers?
A4 (8.5×11 inches) and A5 (5.5×8.5 inches) formats work best for sales distribution flyers, providing optimal readability while remaining cost-effective to print and distribute. Single-sided designs reduce printing costs while maintaining impact. - How long should sales distribution flyer campaigns run for maximum effectiveness?
Most effective sales distribution flyer campaigns run for 4-6 weeks with systematic testing phases. This duration allows for market penetration while preventing audience fatigue and enables optimization based on early response data. - What time of day yields the best results for sales distribution flyer campaigns?
Morning distribution (9-11 AM) and early evening (4-6 PM) typically generate highest pickup rates for sales distribution flyers. These timeframes align with commuter patterns and shopping behaviors in residential and commercial areas. - Which call-to-action phrases work best on sales distribution flyers?
Action-oriented phrases like ‘Call Today for Free Quote’ and ‘Limited Time Offer – Act Now’ consistently outperform generic CTAs on sales distribution flyers. Urgency and clear value propositions drive higher response rates.
Frequently Asked Questions
- What is the average response rate for well-optimized sales distribution flyers?
Well-targeted, professionally designed flyers average 1–3% response rates. Testing headlines, offers, and timing helps boost performance. - How much budget should marketing distribution companies allocate for flyer testing?
Best practice is 15–20% of the campaign budget for testing channels, designs, and messaging before scaling. - Which distribution channels provide the highest ROI for sales flyers?
Hand-to-hand distribution and targeted residential drops deliver 2–4x higher response rates than mass distribution. - How often should sales distribution flyer designs be refreshed for optimal performance?
Refresh flyer designs every 6–8 weeks to avoid fatigue and maintain response rates. - What tracking methods work best for measuring sales distribution flyer effectiveness?
Use QR codes, promo codes, or unique phone numbers for accurate tracking and ROI measurement. - How can weather and seasonal factors impact sales distribution flyer campaigns?
Dry, mild weather boosts responses by 40–60%, while seasonal alignment with events improves engagement. - What paper quality and printing specifications optimize sales distribution flyer performance?
120–150 GSM paper with UV coating increases perceived value and raises response rates by 25–35%. - How can sales distribution flyers be integrated with digital marketing campaigns?
Adding QR codes linking to landing pages doubles or triples conversion rates compared to print alone. - Which demographic targeting strategies work best for local sales distribution campaigns?
Target by age, income, and household type within a 3-mile radius for optimal results. - How can marketing distribution companies reduce flyer waste while maintaining coverage?
Focus on high-traffic areas with target demographics, cutting waste by 40–50% versus mass distribution.
Conclusion: Optimize Distribution Channels And Targeting Success Framework
Sales flyers become powerful lead-generation assets when backed by distribution strategic targeting, channel testing, and precise performance measurement. By integrating geographic analysis, cost-per-lead tracking, and digital tools like QR codes, businesses can eliminate wasteful spending while maximizing ROI through data-driven decision-making.
Long-term success depends on multi-channel optimization that blends physical distribution with digital reinforcement. With consistent A/B testing, demographic precision, and professional flyer design, marketing distribution companies can achieve higher response rates, preserve budgets, and generate sustainable growth through measurable, optimized campaigns.
Reference
- Market research and competitive analysis – SBA, U.S. Small Business Administration.
- Ehavioral Advertising: Tracking, Targeting, and Technology – Federal Trade Commission Protecting America’s Consumers
- How Direct Mail Delivers in the Age of Digital Marketing – MIT Direct Mail Marketing Research.
- The Changing Generational Values – Johns Hopkins Generational Values Research.
- Color Psychology Used in Marketing: An Overview – USC Applied Psychology Color Marketing Research.