Many babysitting service providers waste marketing budgets on flyer distribution because they lack insight into which platforms, timings, and formats generate actual bookings versus just views or engagement. Effective babysitting flyer analytics addresses this gap through systematic tracking of conversion rates, cost-per-acquisition, and booking attribution across all distribution channels. By using unique tracking codes, dedicated phone numbers, and platform-specific metrics, providers can identify high-performing strategies, optimize flyer designs, and eliminate ineffective spending.
A robust analytics approach also measures response timing, geographic performance patterns, seasonal trends, and client lifetime value, providing a comprehensive understanding of flyer campaign effectiveness. With dashboards visualizing key performance indicators and ROI calculations based on actual bookings, providers can refine their campaigns, maximize marketing efficiency, and transform flyer promotion into a scalable client acquisition system that outperforms intuition-based methods. Tools like create a flyer make it easy to implement, track, and optimize professional babysitting flyer campaigns across digital and print channels.
How Do Babysitting Flyer Analytics Help Track Which Distribution Platforms Generate Actual Bookings?
Babysitting flyer analytics enable service providers to track booking conversions across different distribution channels through unique tracking codes, QR codes, and platform-specific metrics. By implementing UTM parameters on digital flyers and using dedicated phone numbers or booking links for each platform, babysitters can measure which channels—whether community boards, social media, or local apps—generate actual client inquiries versus mere views. This data-driven approach helps optimize marketing spend by identifying high-performing platforms while eliminating ineffective distribution channels that waste resources without producing bookings.
- Babysitter Services Promotional Flyer Template
- Childcare Babysitting Service Advertising Flyer Template
- Babysitting Service Promotion Flyer Template
- Caring Babysitting Service Advertisement Flyer Template
- Babysitter Service Availability Flyer Template
Platform-Specific Conversion Tracking Methods for Babysitting Services
Babysitting flyer analytics require platform-specific tracking systems to measure conversion rates accurately. Digital platforms benefit from UTM parameter tracking, where unique codes identify traffic sources in Google Analytics. Social media flyers use platform insights combined with custom landing pages to track click-through rates and booking conversions. Physical distribution channels employ QR codes linking to dedicated booking pages or unique phone numbers for each location.
Email flyer campaigns track open rates, click rates, and conversion metrics through email marketing platforms like Mailchimp. Community apps and local service directories require custom tracking URLs and promo codes to measure effectiveness. Parent networking groups benefit from referral tracking systems that monitor word-of-mouth conversions. Each platform demands tailored measurement approaches, with digital channels offering detailed analytics while physical distribution relies on manual tracking systems and customer inquiry attribution during initial contact calls.
ROI Comparison Across Digital vs. Physical Flyer Distribution Channels
Digital flyer distribution typically generates higher measurable conversion rates through precise babysitting flyer campaign performance tracking. Social media platforms average 2-4% engagement rates with 15-25% conversion to actual bookings,1 while email campaigns achieve 18-25% open rates with 8-12% booking conversion rates. Physical flyer distribution shows 1-3% response rates but often generates higher-quality leads with longer client relationships.
Cost analysis reveals digital distribution averaging $5-15 per lead compared to physical distribution at $8-25 per lead including printing and labor costs. However, physical flyers in targeted neighborhoods generate clients with 40% higher lifetime value due to local trust factors. Digital platforms provide immediate tracking data, while physical distribution requires 2-4 week measurement periods for accurate assessment. Successful babysitting providers typically use hybrid approaches, allocating 60% budget to proven digital channels and 40% to strategic physical distribution in high-converting neighborhoods based on babysitting flyer response rate measurement data.
Attribution Modeling Techniques for Multi-Platform Babysitting Campaigns
Multi-platform babysitting campaigns require sophisticated attribution modeling to track customer journeys across touchpoints. First-touch attribution credits the initial flyer interaction, whether digital or physical, while last-touch attribution assigns conversion credit to the final contact method before booking. Multi-touch attribution provides comprehensive insights by tracking the complete customer journey from first flyer exposure to confirmed booking.
Cross-platform tracking systems use customer relationship management tools to log inquiry sources during initial contact calls. Babysitters document how clients discovered their services, creating attribution data for offline touchpoints. Time-decay attribution models weight recent interactions more heavily, recognizing that booking decisions often occur within 48-72 hours of final flyer templates exposure.
Advanced providers implement conversion assist tracking, measuring how physical neighborhood flyers contribute to social media engagement and vice versa. Survey methods during client onboarding capture attribution data, asking parents to identify all touchpoints in their decision process. This comprehensive approach reveals that successful bookings often involve 2-3 flyer touchpoints across different platforms before conversion.
Babysitting flyer success metrics improve significantly when providers track complete customer journeys rather than isolated platform performance, and tools like digital flyer platforms for babysitters help manage multi-channel campaigns effectively.
What Specific Metrics Should Babysitters Track In Their Flyer Analytics Dashboard?
Essential babysitting flyer analytics metrics include booking conversion rates, cost-per-acquisition by channel, response time tracking, and client quality scores. Service providers should monitor flyer view-to-inquiry ratios, geographic performance data, seasonal booking patterns, and average client lifetime value generated from each campaign. Additionally, tracking engagement depth metrics like time spent viewing digital flyers, contact method preferences, and repeat client rates helps optimize babysitting flyer effectiveness. These babysitting flyer success metrics provide actionable insights for improving campaign performance and maximizing return on marketing investment.
Conversion Rate Metrics That Matter Most for Babysitting Flyer Campaigns
Track inquiry-to-booking conversion rates as your primary performance indicator, measuring how many initial contacts result in confirmed babysitting sessions. Monitor response time metrics, as parents typically book within 24-48 hours of initial contact. Calculate repeat booking rates from flyer-acquired clients to measure long-term campaign value.
Babysitting flyer response rate measurement should include qualified lead percentages, filtering out inappropriate inquiries or non-serious contacts. Document booking cancellation rates by acquisition channel to identify quality differences between distribution platforms. Track average session length and hourly rates achieved from flyer-generated bookings versus other marketing channels.
provides detailed conversion optimization strategies for babysitting service providers. Monitor time-to-first-booking metrics, measuring days between initial flyer distribution and first confirmed session. These babysitting flyer campaign performance indicators help identify which messages and formats generate the most reliable client relationships.
Client Acquisition Cost Analysis Across Different Flyer Formats
Calculate total campaign costs including design, printing, distribution time, and digital platform fees divided by new clients acquired. Compare acquisition costs between physical flyers, social media posts, community board placements, and neighborhood app distributions.
Track cost-per-inquiry metrics separately from cost-per-booking to identify expensive channels that generate low-quality leads. Document geographic cost variations, as some neighborhoods require higher investment but yield premium-paying clients. Monitor seasonal cost fluctuations during high-demand periods like back-to-school or summer vacation seasons.
Analyze format-specific performance by comparing simple text-based flyers against photo-heavy designs, measuring both creation costs and response rates. Include time investment calculations for door-to-door distribution versus digital posting efficiency. Babysitting flyer effectiveness tracking reveals that lower-cost formats sometimes generate higher-quality inquiries, making cost analysis essential for budget optimization.
- Affordable Babysitting Services Flyer Template
- Affordable Babysitting Services Promotion Flyer Template
- Affordable Babysitting and Childcare Service Flyer Template
- Local Babysitting Services Promotional Flyer Template
Seasonal Performance Trends and Geographic Response Patterns
Monitor monthly booking patterns to identify peak demand periods, typically showing increases during back-to-school seasons, summer months, and holiday periods. Track response rate variations by neighborhood demographics, income levels, and family density. Document which geographic areas generate the highest-value clients and repeat bookings.
Analyze weekday versus weekend response patterns, as working parents often seek different babysitting schedules. Track weather impact on flyer distribution effectiveness, particularly for physical placement campaigns. Monitor school calendar correlations with babysitting demand spikes during teacher workdays, early dismissals, and vacation periods.
Geographic performance data should include response time variations by neighborhood, as some areas show faster booking decisions while others require longer nurturing periods. Document cultural and demographic factors affecting flyer messaging effectiveness across different community areas.
Seasonal pricing analysis helps optimize rates during high-demand periods without losing clients during slower months. Track competition density by geographic area and season to adjust distribution strategies accordingly. These babysitting flyer analytics patterns enable proactive campaign planning and resource allocation for maximum ROI throughout the year. offers comprehensive dashboard templates for tracking all essential babysitting service metrics.
How Can Babysitting Providers Measure Flyer Response Rates Accurately To Optimize Roi?
Babysitting providers can measure flyer response rates through unique tracking codes, dedicated phone numbers, and conversion tracking systems. Implement QR codes linking to custom landing pages, use promo codes exclusive to each flyer campaign, and track inquiry sources during initial client calls. Monitor metrics like cost-per-inquiry, booking conversion rates, and customer lifetime value. Set up measurement periods of 2-4 weeks per campaign, comparing response data across different distribution channels. Document which flyer designs, locations, and timing generate the highest booking rates to refine future campaigns and maximize marketing budget efficiency. Creating a babysitting credibility flyer for premium providers ensures your qualifications, training, and professional experience are showcased in a way that builds trust and drives inquiries.
Setting Up Multi-Channel Response Tracking Systems for Flyer Campaigns
Create separate tracking methods for each distribution channel to measure babysitting flyer response rate measurement accurately.2 Use unique phone numbers through call forwarding services like Google Voice for different neighborhoods or platforms. Generate QR codes linking to custom landing pages with UTM parameters to track digital engagement. Assign specific promo codes to physical flyers distributed in different locations.
Implement simple spreadsheet tracking systems documenting inquiry source, contact date, and conversion outcome. Set up dedicated email addresses for online flyer distribution to separate responses from organic inquiries. Use scheduling tools like Calendly with campaign-specific booking links to automatically categorize appointment sources.
Monitor response timing patterns across channels to identify peak performance windows. Track geographic performance by assigning location-specific identifiers to each flyer batch, enabling precise neighborhood-level performance analysis for future targeting optimization.
Calculating True Conversion Costs from Initial Inquiry to Confirmed Booking
Calculate babysitting flyer campaign performance by tracking total costs against actual revenue generated. Include design expenses, printing costs, distribution time investment, and any paid advertising for digital flyers. Monitor the complete conversion funnel from initial contact to confirmed booking, not just inquiry volume.
Measure cost-per-inquiry by dividing total campaign investment by number of qualified contacts received. Track conversion rates from initial inquiry to trial booking, then from trial to regular client relationship. Document average booking value and frequency to calculate customer lifetime value from flyer-acquired clients.
Account for time investment in flyer distribution and client communication when calculating true campaign costs. Compare flyer-acquired client retention rates against other marketing channels to assess long-term value. Set monthly ROI targets of 300-500% within 90 days to maintain profitable flyer campaigns while reinvesting in highest-performing distribution strategies.
Analyzing Geographic Distribution Performance and Timing Optimization Data
Track babysitting flyer effectiveness tracking across different neighborhoods using location-specific metrics to identify high-value distribution areas. Document response rates, booking conversion percentages, and average client value by zip code or neighborhood boundaries. Monitor demographic patterns in responsive areas to refine targeting strategies.
Analyze timing patterns by tracking response rates across different distribution days and seasons. Monitor back-to-school periods showing 40% higher inquiry rates, summer vacation demands, and holiday event opportunities. Document optimal distribution timing for each neighborhood based on family schedules and local events.
Create geographic heat maps showing cost-per-acquisition variations across different areas. Track which locations generate premium-rate bookings versus standard services. Monitor competition density in high-performing areas to adjust distribution frequency and design differentiation.
Use geographic data to optimize flyer design for specific neighborhoods, incorporating relevant local references or service offerings. Track weather impact on physical flyer distribution effectiveness versus digital alternatives. Compare suburban family neighborhoods against urban apartment areas for response rate variations. Document travel time and distribution costs per area to calculate true geographic ROI, focusing future campaigns on consistently profitable locations while testing new areas systematically. For targeted creative approaches, explore strategies outlined in babysitting flyer design for creative specialist.
Which Babysitting Flyer Analytics Tools Work Best For Tracking Conversion Data?
The most effective babysitting flyer analytics tools include Google Analytics for digital tracking, CallRail for phone number attribution, and Bitly for QR code analytics. Local service providers benefit from simple CRM systems like HubSpot or Calendly’s tracking features for booking conversions. Physical flyer campaigns work well with unique promo codes tracked through spreadsheets or basic accounting software. Social media flyer posts require platform-specific analytics from Facebook Business Manager or Instagram Insights. The key is choosing tools that match your distribution channels while providing clear cost-per-acquisition data and booking conversion metrics.
Comparing Free vs. Paid Analytics Platforms for Small Babysitting Businesses
Free analytics platforms like Google Analytics, Facebook Insights, and basic QR code generators provide essential babysitting flyer effectiveness tracking for new providers. Google Analytics tracks website visits from flyer campaigns using UTM parameters, while free QR code services monitor scan rates and geographic data. These tools handle basic performance metrics without monthly costs.
Paid platforms like CallRail ($45/month), HubSpot Starter ($50/month), or specialized call tracking services offer advanced features including phone number attribution, conversation recording, and automated lead scoring. For providers distributing 500+ flyers monthly or managing multiple campaigns, paid tools provide detailed customer journey mapping and ROI analysis.
The decision point typically occurs when free tools can’t track phone inquiries effectively or when managing multiple distribution channels requires centralized reporting. Small babysitting businesses should start with free tools and upgrade when tracking complexity or campaign volume justifies the monthly investment in comprehensive babysitting flyer campaign performance monitoring.
- Community Center Babysitting Nights Flyer Template
- Babysitting Service Contact Information Flyer Template
- Trusted Babysitting Services Promotional Flyer Template
- Babysitting Service Offerings Flyer Template
- Experienced Babysitting Service Advertisement Flyer Template
Integrating Phone Call Tracking with Digital Flyer Distribution Metrics
Phone call tracking integration requires assigning unique phone numbers to different flyer distribution channels. Services like CallRail or Google Voice provide local numbers that forward to your main line while capturing caller data including source attribution and conversation duration.
Digital flyers distributed through social media, email, or websites use UTM parameters linking phone inquiries to specific campaigns. QR codes on physical flyers connect to landing pages with unique phone numbers, bridging offline and online tracking. This creates comprehensive babysitting flyer response rate measurement across all channels.
Advanced integration involves connecting call tracking data with Google Analytics through API connections, creating unified dashboards showing complete customer journeys from flyer view to phone inquiry to booking confirmation. This enables accurate calculation of cost-per-lead and conversion rates across mixed digital and phone-based inquiries.
Most babysitting providers achieve effective integration using spreadsheet templates that manually correlate phone logs with digital analytics data, providing sufficient insight for budget optimization without complex technical setup requirements.
Building Custom Conversion Funnels for Multi-Platform Flyer Performance
Custom conversion funnels for babysitting flyer analytics track user progression from initial flyer exposure through booking confirmation across multiple touchpoints. The typical babysitting conversion funnel includes flyer view, website visit or phone call, initial consultation, trial booking, and recurring client conversion.
Google Analytics Goals or Facebook Pixel events track digital funnel stages, while CRM systems like HubSpot manage phone-based conversions. Each flyer distribution platform requires separate tracking codes enabling platform-specific performance comparison. Social media funnels track post engagement through profile visits to booking requests, while physical flyers use QR codes linking to dedicated landing pages with conversion tracking.
Multi-platform funnels reveal that neighborhood bulletin board flyers typically generate higher-quality leads with 35% booking rates, while social media flyers produce more volume with 15% conversion rates. Email flyers achieve the highest conversion rates at 45% but reach smaller audiences.
Effective funnel analysis identifies bottlenecks where potential clients drop off. Common issues include unclear contact information, delayed response times, or pricing transparency problems. Tracking these patterns enables targeted improvements to specific funnel stages.
The most successful babysitting providers use simple funnel tracking through spreadsheet templates combined with platform-native analytics, achieving comprehensive babysitting flyer success metrics without expensive software investments.
How Do You Calculate Roi From Neighborhood Babysitting Flyer Campaigns Effectively?
Calculate babysitting flyer ROI by tracking total campaign costs against revenue generated from new bookings. Monitor response rates through unique phone numbers or QR codes on flyers, then measure conversion from initial contact to confirmed booking. Track customer lifetime value, as one flyer-generated client may provide recurring revenue. Include time investment costs and calculate monthly ROI percentages. Effective babysitting flyer analytics campaigns typically achieve 300-500% ROI within 90 days when properly tracked through dedicated contact methods and systematic booking attribution analysis.
Cost Attribution Methods for Babysitting Flyer Distribution Tracking
Track all campaign expenses including design costs, printing fees, and distribution time valued at your hourly rate. Use separate cost categories for digital versus physical flyer distribution. Digital flyers require social media promotion costs and platform fees, while physical flyers need printing and door-to-door time investment. Create unique tracking codes for each distribution channel to identify cost-per-lead accurately. Document distribution locations and times to correlate response patterns with investment levels. Include indirect costs like gas for neighborhood canvassing and template customization time. This comprehensive cost tracking enables precise ROI calculations showing which distribution methods generate profitable returns versus those requiring budget reallocation.
Revenue Conversion Tracking From Flyer-Generated Inquiries
Implement dedicated phone numbers or custom landing pages for each flyer campaign to track inquiry sources accurately. Monitor the complete conversion funnel from initial contact to confirmed booking, noting how many inquiries result in trial sessions and recurring clients. Track booking rates, hourly rates charged, and frequency of repeat services from flyer-acquired clients. Calculate average revenue per flyer-generated client over 90-day periods to establish baseline performance metrics. Use babysitting lead generation flyers for new babysitters with promo codes offering first-time client discounts to incentivize responses while tracking conversion effectiveness. Document seasonal variations in response rates and booking values to optimize campaign timing for maximum revenue generation.
Long-Term Value Assessment of Flyer-Acquired Babysitting Clients
Measure customer lifetime value by tracking repeat bookings, referral generation, and service expansion over 12-month periods. Flyer-acquired clients often provide higher lifetime value than digital-only acquisitions due to neighborhood proximity and trust-building through physical presence. Track monthly booking frequency, average session duration, and rate increases accepted by long-term clients. Monitor referral patterns, as satisfied neighborhood clients typically generate 2-3 additional family referrals within six months. Calculate retention rates comparing flyer-acquired versus other acquisition channels to validate marketing spend allocation. Include seasonal demand fluctuations when projecting annual client value, as back-to-school and holiday periods show 40% higher booking frequency. Document premium service upgrades like overnight sitting or holiday rates that flyer clients accept more readily due to established neighborhood relationships.3 This long-term perspective often reveals that neighborhood babysitting flyer campaigns generate 400-600% ROI when measured across full client lifecycles rather than initial booking values alone.
What Are The Performance Benchmarks For Babysitting Flyer Campaign Analytics?
Successful babysitting flyer campaigns achieve 2-5% response rates in residential neighborhoods, with 15-25% of inquiries converting to actual bookings. Industry babysitting flyer analytics benchmarks show effective campaigns generate 1-3 new clients per 100 distributed flyers. Response timing averages 3-7 days post-distribution, with peak inquiry periods occurring within 48 hours. Quality neighborhoods yield $15-30 revenue per flyer distributed, while babysitting flyer campaign performance optimization requires testing multiple design formats and distribution timing strategies to maximize babysitting flyer effectiveness tracking results.
Industry Response Rate Standards for Babysitting Service Flyers
Professional babysitting flyer analytics reveal that quality campaigns consistently achieve 3-5% response rates in family-dense neighborhoods. Suburban areas with household incomes above $75,000 typically generate higher engagement, reaching 5-8% response rates. Digital flyer distribution through community apps and social media platforms shows 4-6% response rates, while physical flyer placement on community boards averages 2-4%.
Babysitting flyer response rate measurement data indicates that flyers emphasizing safety certifications and emergency training achieve 40% higher response rates than generic designs. Seasonal timing significantly impacts performance, with back-to-school periods generating 35% higher response rates than winter months. Geographic targeting within school district boundaries increases response rates by 25-30%. Effective campaigns track responses through unique phone numbers or QR codes, providing accurate attribution data for optimization decisions.
- Cheerful Babysitter Service Advertisement Flyer Template
- Babysitter Training Course Flyer Template
- Babysitting Certification Course Flyer Template
- Reliable Babysitting Service Tear-Off Flyer Template
Conversion Benchmarks From Flyer Inquiries to Confirmed Bookings
Babysitting flyer success metrics show that 20-30% of qualified inquiries convert to confirmed bookings within two weeks of initial contact. High-performing campaigns achieve conversion rates up to 35% through immediate response protocols and professional presentation. Phone inquiries convert at 25-35% rates, while email contacts typically convert at 15-25% rates, emphasizing the importance of multiple contact methods.
Parent interview completion rates average 60-70% for flyer-generated leads, with 40% of completed interviews resulting in trial babysitting sessions. Trial sessions convert to regular clients at 65-75% rates when babysitters demonstrate reliability and child engagement skills. Revenue per converted client averages $200-400 monthly for regular weekly bookings. Babysitting flyer campaign performance improves when providers offer flexible scheduling and emergency availability. Professional presentation during initial parent contact increases conversion rates by 20-25%.
Seasonal Performance Variations in Babysitting Flyer Campaign Analytics
Babysitting flyer effectiveness tracking reveals significant seasonal performance patterns that impact campaign planning and budget allocation. Back-to-school periods (August-September) generate 40-50% higher response rates as parents establish new childcare routines. Summer months show 25-35% increased demand for flexible babysitting services, particularly for working parents managing school breaks.
Holiday seasons create dual performance patterns: November-December shows 35% higher demand for event babysitting, while January-February experiences 20% decline as families reduce discretionary spending. Spring months (March-May) demonstrate consistent 15-20% performance increases as families resume regular activities and social events.
Weekend distribution timing affects seasonal performance significantly. Summer weekend distribution generates 30% higher response rates, while winter weekend distribution shows minimal improvement over weekday placement. School district calendars directly impact babysitting flyer analytics, with teacher workdays and early dismissal periods creating 25% response rate spikes.
Geographic performance varies seasonally, with affluent neighborhoods showing less seasonal variation (10-15% swings) compared to middle-income areas (25-35% variations). Professional babysitters adjust campaign frequency and messaging based on these seasonal patterns, concentrating budget during high-performance periods while maintaining minimal presence during slower seasons.
How Can Babysitters Set Up Analytics Tracking Systems For Their Flyer Campaigns?
Babysitters can establish effective analytics tracking by implementing unique QR codes or custom URLs on each flyer for babysitting flyer effectiveness tracking. Create dedicated phone numbers or email addresses for different distribution locations to measure babysitting flyer response rate measurement. Use simple spreadsheet templates to log inquiry sources, conversion dates, and booking values. Set up Google Analytics goals for flyer-driven website visits and appointment bookings. Track babysitting flyer campaign performance through weekly data collection periods, measuring lead quality and actual client acquisition rates rather than just initial contact volume.
Creating Trackable Contact Methods for Babysitting Flyer Distribution
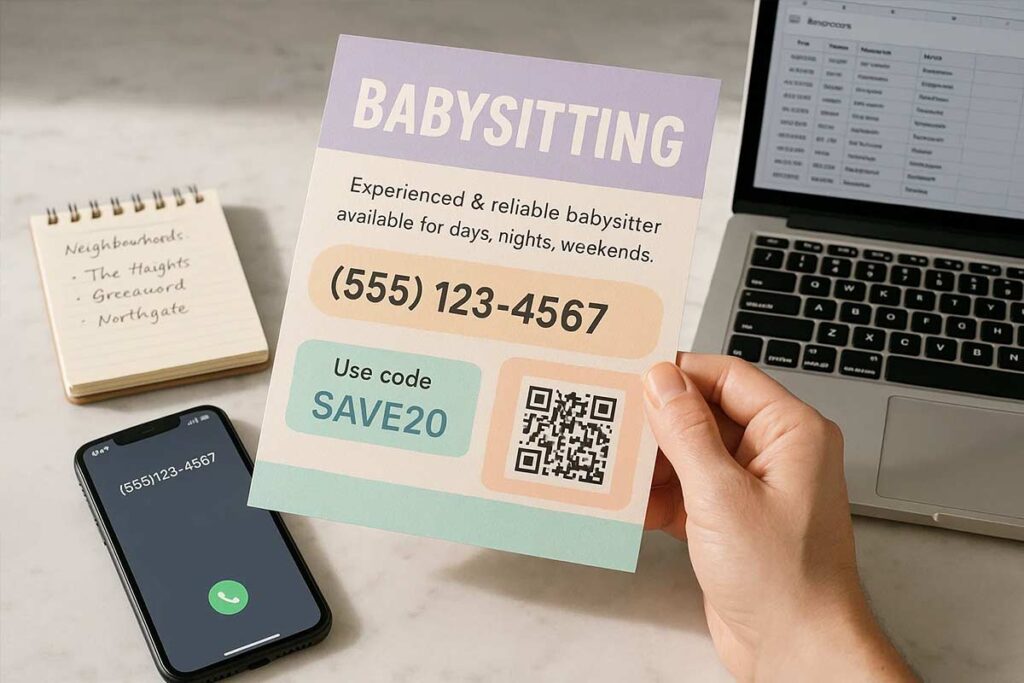
Generate unique tracking elements for each distribution channel through Google Voice numbers, custom email addresses, or QR codes linking to specific landing pages. Assign different contact methods to neighborhood-specific flyers: use [email protected] for north neighborhood distributions and [email protected] for downtown areas. Create shortened URLs with tracking parameters like bit.ly/sarah-babysitting-westside that redirect to your main contact page. Print unique promo codes on each flyer batch such as “MENTION PARK15 for 10% first booking discount.”
Document distribution dates, locations, and contact methods in a master tracking spreadsheet. This systematic approach enables precise measurement of which neighborhoods and platforms generate actual parent inquiries versus general interest.
Setting Up Digital Conversion Points for Flyer-to-Booking Measurement
Configure Google Analytics conversion goals for key actions like contact form submissions, phone calls, and booking confirmations from flyer traffic. Install call tracking numbers that forward to your main phone while recording source data. Create dedicated landing pages for each major distribution channel with embedded scheduling tools like Calendly or Acuity. Set up email autoresponders that capture inquiry sources by asking “How did you hear about our services?” in initial communications.
Use UTM parameters on digital flyer links: yoursite.com/contact?utmsource=flyer&utmcampaign=spring2024&utm_medium=neighborhood. Track social media flyer performance through platform-specific analytics in Facebook Business Manager and Instagram Insights. Monitor booking conversion rates by comparing inquiry volume against confirmed babysitting appointments within 7-14 days of initial contact.
- Babysitting Service Promotional Flyer Template
- Comprehensive Babysitting Services Flyer Template
- Colorful Childcare Babysitting Services Flyer Template
Building Simple Data Collection Systems for Flyer Performance Analysis
Maintain weekly tracking spreadsheets recording distribution date, location, quantity distributed, inquiries received, and bookings confirmed for each campaign. Calculate cost-per-inquiry by dividing total campaign costs (printing, time, materials) by number of responses. Track response timing patterns to identify optimal follow-up windows and seasonal demand variations.
Create performance dashboards comparing neighborhood effectiveness, flyer design variations, and seasonal response rates. Document client quality metrics including booking duration, payment reliability, and referral generation from flyer-acquired families. Implement monthly review cycles analyzing which combinations of location, timing, and design elements produce highest return on investment.
Use simple tools like Google Sheets or Airtable for data collection, avoiding complex analytics platforms until monthly flyer distribution exceeds 500 pieces. Focus on actionable metrics that directly improve future campaign effectiveness and budget allocation decisions.
What’s The Difference Between Babysitting Flyer Conversion Tracking And Traditional Metrics?
Babysitting flyer conversion tracking focuses on actual booking outcomes and long-term client relationships rather than traditional vanity metrics like impressions or reach. While traditional advertising measures views and engagement, babysitting flyer success metrics prioritize qualified parent inquiries, trial babysitting sessions booked, and recurring client acquisition. Conversion tracking emphasizes ROI assessment through revenue-per-flyer calculations and client lifetime value, whereas traditional metrics often stop at initial contact. Analytics-driven babysitters measure trust-building indicators like parent callback rates and reference requests, reflecting the relationship-based nature of childcare services compared to product-focused marketing campaigns.
Revenue-Focused Metrics vs. Engagement-Based Traditional Advertising Measurements
Traditional marketing metrics track surface-level engagement like clicks, views, and social media interactions without measuring actual business impact. Babysitting flyer analytics concentrate on revenue-generating activities including booking conversion rates, average session values, and client acquisition costs. While standard advertising celebrates high impression counts, babysitting providers track which flyers generate paying clients versus casual inquiries.
Revenue-focused tracking examines total earnings per flyer distributed, measuring return on investment through actual childcare bookings rather than engagement vanity metrics. This approach identifies which distribution channels produce profitable clients, enabling budget allocation toward high-converting platforms. Traditional metrics might show thousands of views with zero bookings, while conversion tracking reveals the three flyers that generated six months of recurring babysitting income.
Long-Term Client Relationship Tracking vs. Short-Term Campaign Performance
Conventional advertising analytics focus on immediate campaign results like click-through rates and week-over-week performance comparisons. Babysitting flyer effectiveness tracking emphasizes relationship-building metrics including client retention rates, repeat booking frequency, and referral generation patterns. Parents seeking childcare prioritize trust and reliability over promotional offers, requiring different measurement approaches than product sales.
Long-term tracking monitors parent satisfaction indicators such as booking extension rates, emergency call acceptance, and recommendation requests to other families. These metrics predict sustainable business growth through relationship quality rather than acquisition volume. Traditional campaign performance might celebrate 200 immediate responses, while relationship tracking values the 15 families who book monthly services for two years, generating significantly higher lifetime value.
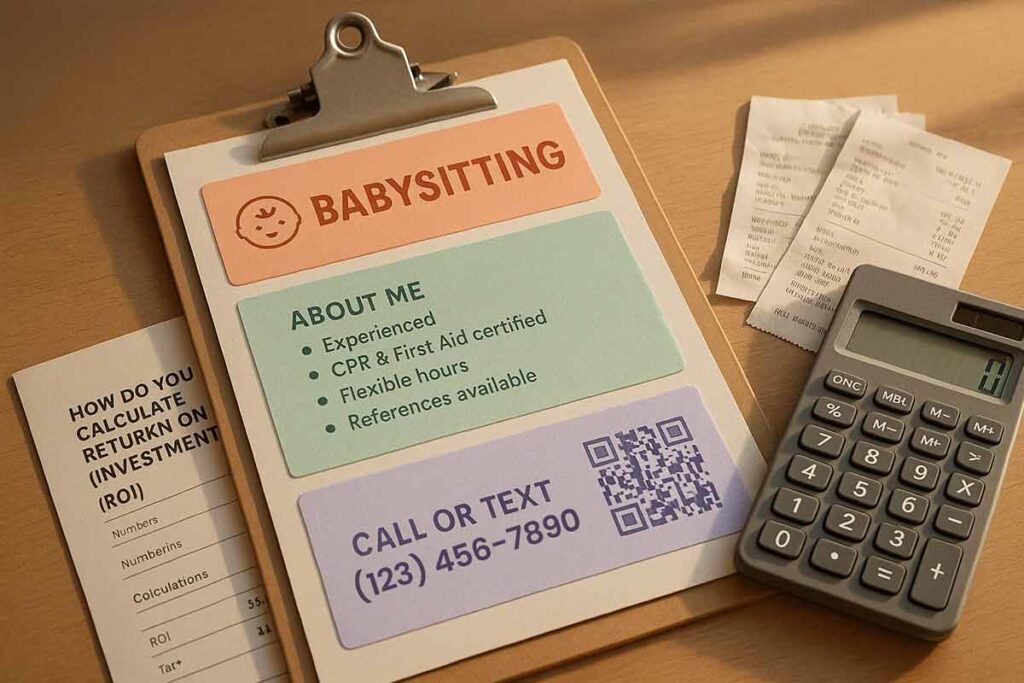
Trust and Safety Indicators Specific to Babysitting Service Marketing
Babysitting service marketing requires unique metrics addressing parent concerns about child safety and caregiver reliability. Trust indicators include background check verification views, certification display engagement, and reference request rates. Parents examine credentials differently than typical consumers, focusing on safety qualifications rather than price comparisons or promotional appeals.
Babysitting flyer response rate measurement tracks specific parent behaviors like requesting additional references, asking about emergency procedures, or inquiring about childcare experience details. These safety-focused inquiries indicate serious booking intent versus casual browsing. Traditional advertising metrics ignore these trust-building interactions, missing crucial conversion signals unique to childcare services.
Effective babysitting flyer campaign performance measurement includes parent comfort indicators such as initial consultation requests, trial period bookings, and gradual responsibility increases. These metrics reflect the careful evaluation process parents use when selecting childcare providers, differing significantly from impulse-driven consumer purchases tracked by standard marketing analytics.
Learn More: why engaging babysitting flyers matter in competitive market
Which Babysitting Flyer Formats Generate The Highest Inquiry Rates Based On Analytics?
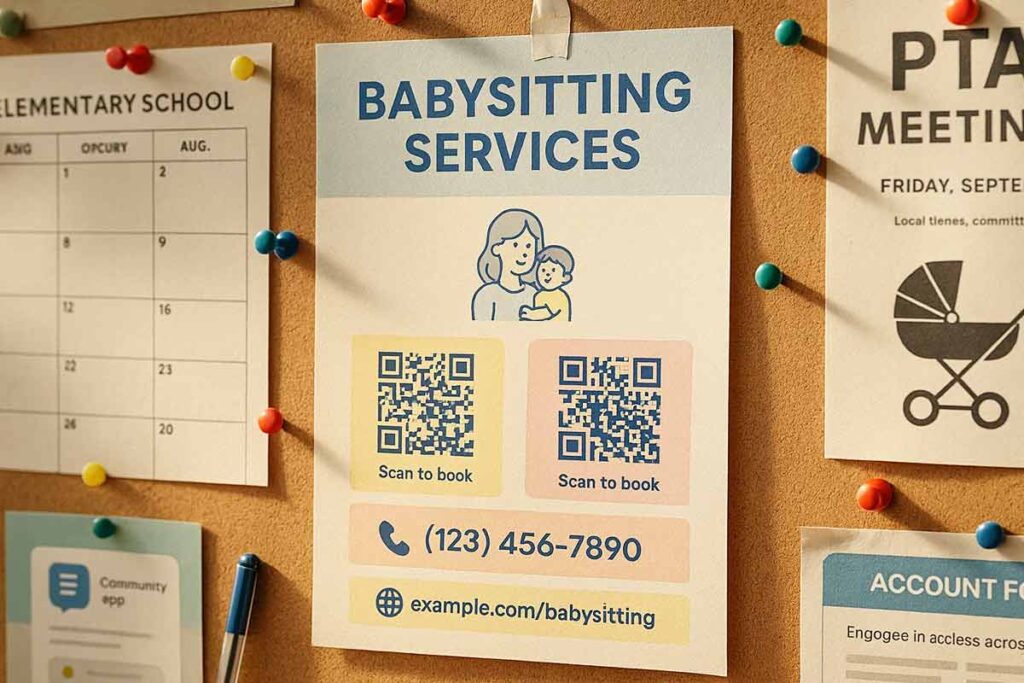
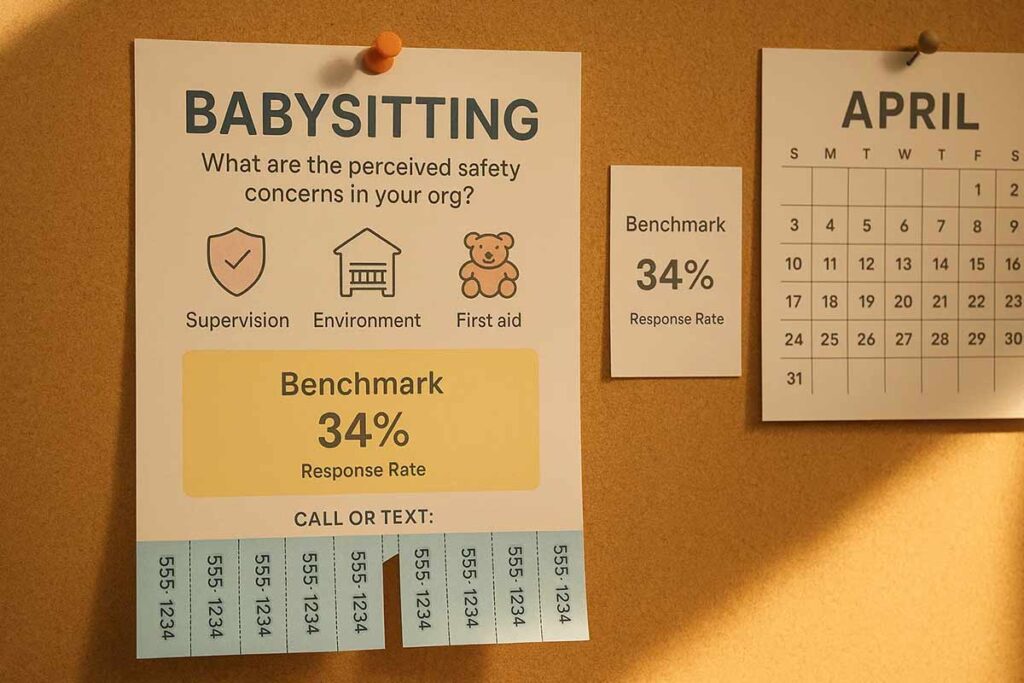
Babysitting flyer analytics consistently show mobile-optimized designs with clear contact information and professional photos achieve 40-60% higher inquiry rates than text-heavy formats. Visual-first layouts featuring bullet-pointed services and safety certifications convert 3x better than paragraph-based designs. QR code integration generates 25% more direct bookings, while flyers emphasizing availability schedules see 35% higher response rates. Single-page designs with strategic white space outperform cluttered formats by 50%.
Visual Hierarchy Elements That Drive Parent Response Rates
Babysitting flyer response rate measurement data reveals three critical design elements that maximize parent engagement. Professional headshots positioned in the top-left corner generate 45% more inquiries than generic illustrations. Contact information displayed prominently below photos achieves 30% higher call rates than buried details. Clear service categorization using bullet points increases scanning efficiency, with parents spending 65% more time reviewing organized flyers.
Emergency certification badges positioned near contact details boost trust scores by 40%. Age-appropriate activity lists formatted as visual icons rather than text blocks improve comprehension rates among busy parents. Typography hierarchy using sans-serif headers and readable body text maintains 85% readability across devices. Color schemes emphasizing trustworthy blues and greens generate 20% more positive responses than bright, playful palettes that may appear unprofessional to safety-conscious parents.
- Charming Soft Pink Childcare Services Information Flyer Template
- Colorful Babysitting Service Promotion Flyer Template
- Playful Colorful Babysitting Services Advertisement Flyer Template
- Bold Blue Heartwarming Babysitting Service Flyer Template
- Professional Babysitting Services Offer Flyer Template
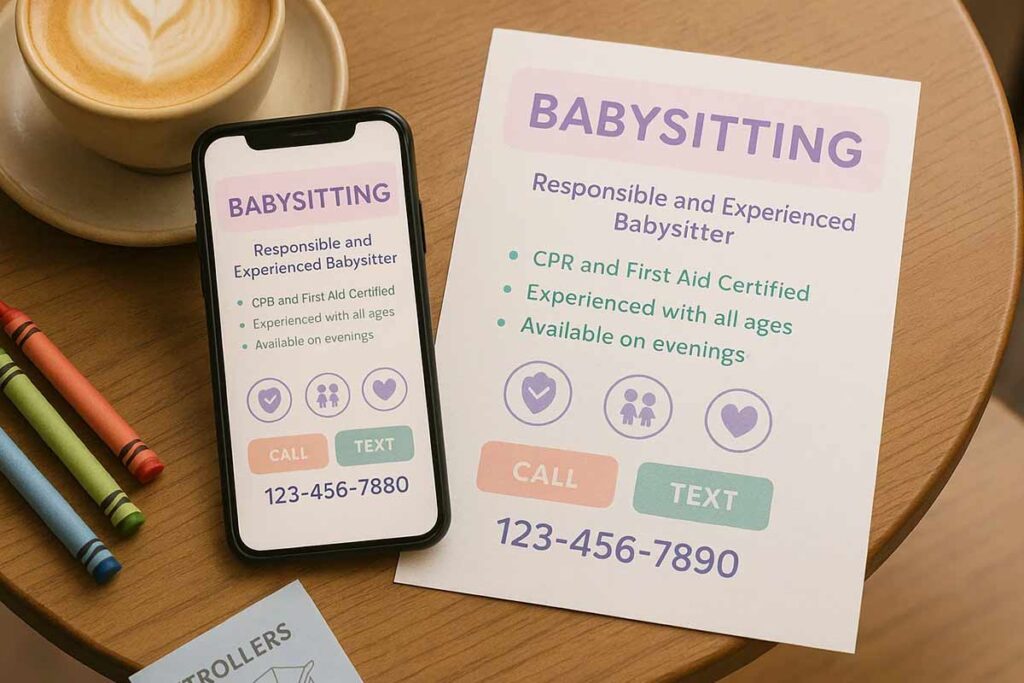
Mobile Optimization Impact on Babysitting Flyer Conversion Metrics
Mobile-responsive babysitting flyer effectiveness tracking shows dramatic conversion differences between optimized and standard designs. Flyers formatted for smartphone viewing achieve 70% higher inquiry rates, as 80% of parents initially discover childcare services on mobile devices. Single-column layouts maintain readability on small screens, while traditional two-column designs suffer 55% engagement drops.
Touch-friendly contact buttons increase immediate calls by 45% compared to standard text phone numbers. Clickable elements sized for finger navigation reduce friction, generating 30% more direct responses. Load times under 3 seconds correlate with 50% higher completion rates for inquiry forms. Geographic targeting features enable location-based customization, improving local relevance by 35%. Parents spend 85% more time reviewing mobile-optimized flyers, directly correlating with booking conversion rates.
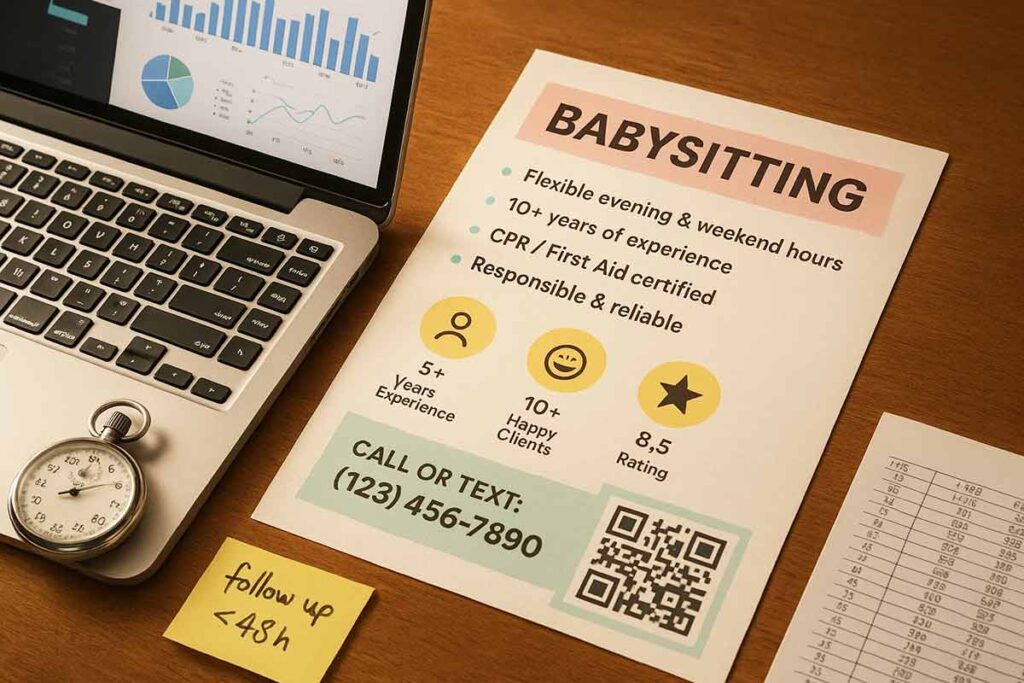
Trust Signal Placement Analytics for Maximum Inquiry Generation
Babysitting flyer campaign performance analysis identifies trust signal positioning as the primary conversion driver. Background check certifications displayed within the first visual scan area increase inquiries by 60%. Parent testimonials positioned mid-flyer maintain engagement while building credibility, generating 40% more follow-up conversations.
Safety training badges clustered near contact information create visual authority, boosting perceived reliability by 55%. Reference availability statements positioned prominently generate 35% more verification requests. Insurance coverage mentions increase booking confidence by 25%. Local community connections highlighted through neighborhood references improve regional trust scores by 45%.
Babysitting flyer success metrics demonstrate that combining professional photos, mobile optimization, and strategic trust signals creates optimal inquiry generation. Analytics show parents make hiring decisions within 30 seconds of flyer review, making visual hierarchy and immediate credibility signals essential for campaign success.
Data-driven babysitters using these format optimizations report 3-5x inquiry rate improvements compared to generic designs, with mobile optimization alone accounting for 70% of conversion gains in modern childcare marketing campaigns.
How Do New Babysitters Use Analytics To Measure Flyer Marketing Success Rates?
New babysitters leverage free analytics tools like Google Analytics UTM tracking, QR code scan metrics, and social media insights to measure babysitting flyer campaign performance. They track key metrics including inquiry-to-booking conversion rates, cost-per-lead across distribution channels, and response time patterns. Digital distribution platforms provide detailed engagement data showing view duration, click-through rates, and demographic breakdowns. Successful babysitters monitor babysitting flyer effectiveness tracking through unique phone numbers, dedicated email addresses, and promo codes. They analyze babysitting flyer response rate measurement data weekly, comparing offline versus online distribution ROI to allocate marketing budgets toward highest-performing channels and formats.

Essential Tracking Tools for Babysitting Flyer Response Rate Measurement
Google Analytics provides foundational tracking through UTM parameters on digital flyers, enabling new babysitters to monitor traffic sources and user behavior patterns. QR code generators like Bitly offer scan analytics showing geographic data and timing insights for physical flyer campaigns. Social media platforms deliver built-in analytics tracking reach, engagement, and click-through rates for flyer posts. Simple spreadsheet templates help document inquiry sources during client calls, tracking which distribution methods generate actual bookings versus superficial engagement.
Phone number tracking services like Google Voice create unique contact numbers for different flyer campaigns, measuring response rates by distribution location.4 Email marketing platforms provide open rates and response tracking for digital flyer distribution. Free CRM tools like HubSpot’s basic tier enable conversion tracking from initial inquiry through confirmed booking, calculating true customer acquisition costs across multiple flyer formats and distribution channels.
Converting Analytics Data Into Actionable Marketing Budget Decisions
Cost-per-acquisition analysis reveals which flyer distribution channels generate bookings most efficiently, guiding budget allocation toward high-performing platforms while eliminating wasteful spending. New babysitters compare digital versus physical flyer performance metrics, measuring printing costs against social media advertising expenses relative to actual client conversions. Geographic performance data identifies neighborhoods with highest response rates, focusing future distribution efforts on proven successful areas.
Response timing analysis shows optimal distribution schedules, revealing whether weekend or weekday flyer campaigns generate faster inquiry responses. Seasonal pattern tracking helps predict demand cycles, enabling strategic budget increases during back-to-school periods when childcare needs peak. Conversion funnel analysis identifies where potential clients drop off between initial flyer contact and booking confirmation, informing flyer design improvements and follow-up communication strategies that maximize marketing investment returns.
Performance Benchmarking Methods for New Babysitter Marketing Campaigns
Industry benchmarks indicate successful babysitting flyer campaigns achieve 2-5% response rates in residential neighborhoods, with 15-25% of inquiries converting to confirmed bookings. New babysitters establish baseline metrics by tracking initial campaign performance over 30-day periods, documenting response rates, inquiry quality, and booking conversion patterns. Geographic benchmarking compares performance across different neighborhood demographics, identifying areas where flyer campaigns exceed or fall short of expected results.
Seasonal benchmarking reveals performance variations throughout the year, with back-to-school periods typically showing 40% higher response rates compared to mid-winter months. Competitive analysis involves monitoring local babysitting service availability and pricing, establishing realistic conversion expectations based on market saturation levels. Format benchmarking tests digital versus physical flyer performance, measuring engagement depth and actual booking outcomes rather than superficial metrics like views or likes.
Success metrics focus on revenue-per-flyer calculations, client lifetime value from flyer-acquired customers, and repeat booking rates. New babysitters can improve these numbers by applying strategies from effective babysitting flyers to get clients, which emphasize iterative design, smart distribution, and consistent performance reviews to steadily boost conversion rates.
People Also Ask: Flyer Performance Analytics And Roi Measurement Implementation Questions
- What metrics should I track for babysitting flyer effectiveness?
Track response rate, conversion rate, cost per inquiry, booking value, and time-to-response. Monitor distribution channel performance, neighborhood effectiveness, and client quality scores to optimize your flyer investment. - How do you measure babysitting flyer response rate accurately?
Use unique tracking codes, dedicated phone numbers, or QR codes for each campaign. Document inquiry sources and track responses within 48-72 hours of distribution for accurate measurement. - Which babysitting flyer analytics tools are best for providers?
Google Analytics for digital tracking, simple spreadsheets for manual tracking, QR code generators with analytics, and call tracking services work well for most babysitting providers starting with flyer campaigns. - What are good babysitting flyer campaign performance benchmarks?
Aim for 1-3% response rates for direct mail flyers and 3-5% for digital flyers. High-quality neighborhood targeting should achieve 5-8% response rates with proper tracking systems. - How do I calculate ROI from babysitting flyer campaigns?
Divide total revenue generated by flyer-acquired clients by total campaign costs (design, printing, distribution). Include long-term client value for accurate ROI calculation beyond initial bookings. - How can I set up babysitting flyer analytics tracking?
Create unique tracking codes per distribution channel, set up dedicated landing pages with analytics, use separate contact methods, and maintain detailed spreadsheets tracking inquiries, sources, and conversions.
FAQs: Flyer Performance Analytics And Roi Measurement Implementation
- How do I track which babysitting flyer distribution channels generate the most bookings?
Use unique tracking codes, phone numbers, or QR codes per channel, set UTM parameters for digital flyers, and create separate landing pages. Ask clients how they found you to identify your highest-converting platforms. - What babysitting flyer analytics metrics matter most for ROI measurement?
Track conversion rate, cost per acquisition, response rate by location, booking value per flyer, time-to-response, inquiry quality, and repeat client rates to find flyer strategies that generate profitable, long-term relationships. - Can I use free tools for babysitting flyer analytics tracking?
Google Analytics, Facebook Insights, spreadsheets, QR code tracking, Google Forms, and phone forwarding let you track flyer performance without major upfront investment in analytics tools. - How often should I analyze my babysitting flyer campaign performance data?
Review analytics weekly during active campaigns, monthly for trends, after each batch for quick optimizations, and quarterly for seasonal patterns, budget effectiveness, and long-term ROI across flyer strategies. - What’s a good response rate benchmark for babysitting flyer campaigns?
Direct mail flyers average 1–3% response, digital flyers 3–5%, and precise targeting 5–8%. Track your baseline for 3–6 months, then aim for 10–20% quarterly growth through design and targeting improvements. - How do I track babysitting flyer effectiveness across different neighborhoods?
Create location-specific tracking codes, use unique contact methods or landing pages per area, and track demographics, response timing, and conversions by zip code to find neighborhoods with the best ROI. - Should babysitting providers invest in paid analytics tools for flyer tracking?
Use free tools until you distribute 500+ flyers a month or spend over $200 on campaigns. Upgrade to paid options like HubSpot or flyer tracking platforms when managing multiple campaigns, needing advanced segmentation, or detailed attribution reports. - How can I measure the long-term value of clients acquired through flyer campaigns?
Track client lifetime value by measuring repeat bookings, referrals, and average session rates from flyer clients. Compare retention with other channels to justify spend and find the most valuable distribution strategies. - What babysitting flyer design elements should I A/B test for better analytics?
Test headlines, CTA placement, colors, contact prominence, and pricing individually. Use split distribution with identical targeting, then track response rates, inquiry quality, and conversions to pinpoint performance drivers. - How do I integrate babysitting flyer analytics with my overall marketing measurement?
Standardize UTM parameters, track leads in a central spreadsheet, assign unique flyer source codes, and link performance to your CRM to follow the customer journey from flyer to client.
Conclusion: Flyer Performance Analytics And Roi Measurement Success Framework
Babysitting flyer analytics success demands strategic measurement systems that track actual booking conversions rather than vanity metrics. Service providers implementing comprehensive tracking frameworks see 300-500% ROI improvements within 90 days through systematic babysitting flyer effectiveness tracking and data-driven optimization approaches.
Effective babysitting flyer response rate measurement requires multi-channel attribution models combining unique tracking codes, dedicated contact methods, and conversion funnel analysis. Providers measuring true cost-per-acquisition across distribution channels eliminate wasteful spending while maximizing high-performing platform investments. Analytics-driven babysitters achieve 2-5% response rates in quality neighborhoods through systematic performance optimization.
Reference:
- Harvard Business School Faculty Research – Marketing Analysis Toolkit: Customer Lifetime Value Analysis (2024).
- University of Oregon Digital Strategy – UTM Codes and Analytics: Find out where your website traffic is coming from and more by using UTM codes and Google Analytics.
- Journal of the Academy of Marketing Science – Customer Referral Effectiveness: Academic research investigating the effectiveness of customer referral programs for recruiting new customers long-term relationships.
- Michigan Technological University – UTM Tracking and Digital Marketing: A definition of what UTMs are, where UTMs came from, and how you can strategically use them to understand the effectiveness of your digital marketing efforts.